Slits
- diffraction effects

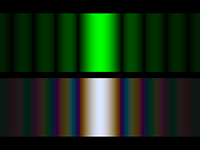
Diffraction through a single slit.
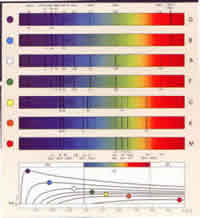
This effect of diffraction is superimposed on all of the multiple slit images we see below. The central maximum is twice the width of the ones either side and it is very much brighter - see the graph of the intensity below.
Top image shows monochromatic light, bottom image shows white light - see how the red end of the spectrum is diffracted the most, making the colours spread out and note that the central fringe is white - as all of the colours are at that point.
|
|
In practice we look at the fringe pattern produced within that central maximum. The narrower the slits the wider that central maximum will be (see diagram below - its width is 2 /a - where 'a' is the width of the slit). Therefore the narrower the slit the broader the central maximum. /a - where 'a' is the width of the slit). Therefore the narrower the slit the broader the central maximum.
NB 'a' is the aperture size - intensity maxima for the single slit pattern envelope occur at the straight through position (principal maximum) and thereafter half way between the minima. The minima occur at multiples of /a.
In the following images the slits are very narrow and the photo only shows what happens within the central bright region. There would be dark bands in the left picture would be far outside of the details shown in the following images. |
Double slit - Young's slits |
|
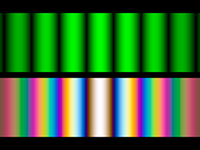
Three equally spaced slits.
Adding a third slit at the same distance, the intensity maxima are preserved. Between them there are now two dark bands and a faint secondary maximum.
The pattern produced by white light shows more intense colours. |
|
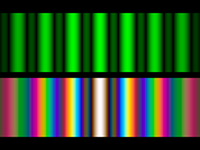
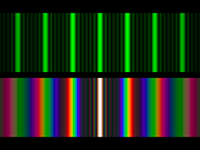
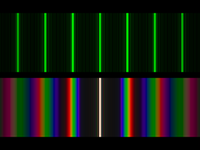
Seven equally spaced slits
The bright "lines" are now separated by six dark bands and five faint secondary maxima.
The colours of the "first order" diffraction maximum on both sides of the central white beam approach saturated spectral colours. The short-wave (blue-violet) end of the third-order diffraction already overlaps the long-wave (red) end of the second order. |
|
|
The more slits, the narrower are the main maxima and the weaker are the secondary maxima between them. |
|
A diffraction grating has hundreds of lines etched onto it. You cannot see the lines - you just see an
iridescent pattern on it in bright light - or it looks black. Because it has so many lines it has the ability to disperse light better than a prism. It is the tool of choice for separating the colours in incident light because it spreads the colours out so much better.
The more lines per millimetre the further the diffracted lines will spread out and the less likely you are to have the 'orders of diffraction' overlapping.... but if you want to see more than one order of diffraction you need to make sure the diffraction grating does not have too many lines. |
|
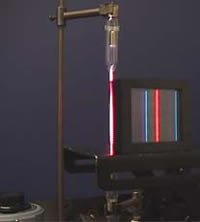
The photo on the right shows the hydrogen spectrum being produced in a lab. The hydrogen gas in a thin glass tube is excited by an electrical discharge and the spectrum can be viewed through the grating.
|
|
In a similar way we can look at the spectra from stars and use the information to work out which chemicals are in the star and to work out the star's red shift.
We know the pattern of lines (the spectrum) from each element - they are like fingerprints of the element. When we look at the light from a star we can spot these line patterns and identify the elements. How much the pattern has been shifted towards the red end of the spectrum gives us the red shift of the star - so that we can work out it is moving away from us.
(See atomic spectra and red shift). |
|

Here is a great interactive resource from the University of Colorado....