
 |
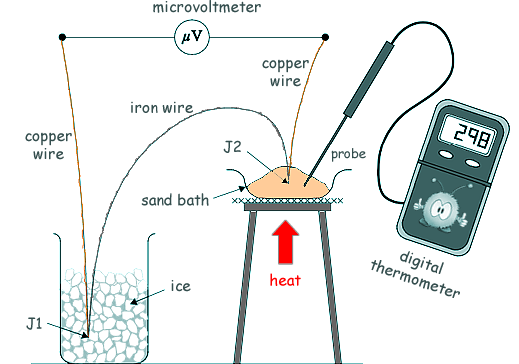
Questions on EMF and internal resistance Q12. Lengths of copper and iron wire are joined together to form junctions J1 and J2. When J1 and J2 are at different temperatures an emf ε is generated between them. This emf is measured using a microvoltmeter. The diagram below shows J1 kept at 0 ºC while J2 is heated in a sand bath to a temperature θ, measured by a digital thermometer.
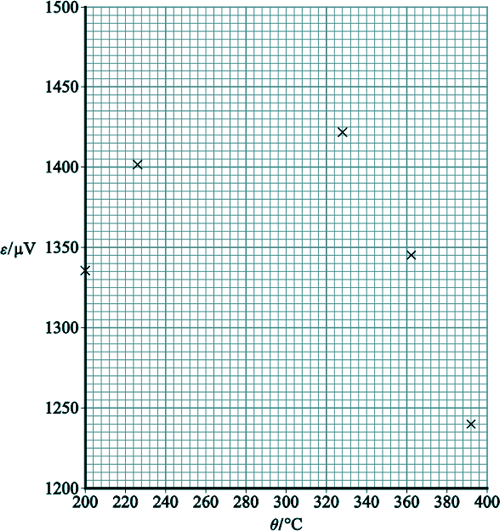
(a) An experiment is carried out to determine how ε depends on θ. The results of the experiment are shown in the table below and, below that, a graph is plotted of these data.
[1 mark]
[1 mark]
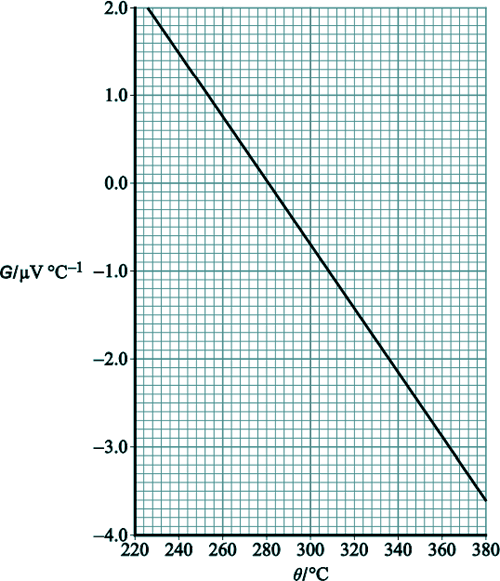
[1 mark] (b) The gradient G of the graph in part (a) is measured for values of θ between 220 °C and 380 °C. A graph of G against θ is plotted below:
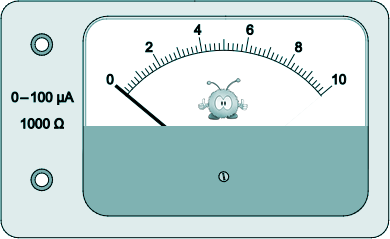
The neutral temperature θn is the temperature corresponding to the maximum value of ε. θn can be determined using either of the two graphs. Explain why a more accurate result for θn may be obtained using the second graph. [1 mark] (c) It can be shown that G is given by G = βθ +α where α and β are constants Determine α. [2 marks] (d) Enrico decides to carry out a similar experiment. He thinks the meter pictured below could be used as the microvoltmeter to measure ε.
When this meter indicates a maximum reading and the needle points to the right-hand end of the scale (full-scale deflection), the current in the meter is 100 µA. The meter has a resistance of 1000 Ω.
[1 mark]
[2 marks] (Total 8 marks)
|
Follow me...
|


Cyberphysics - a web-based teaching aid - for students of physics, their teachers and parents....
