A level: Kinetic Theory Questions Q9.
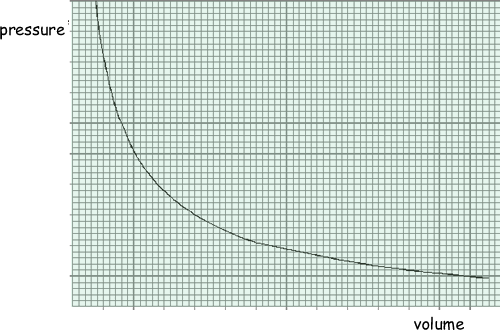
The graph shows how the pressure of an ideal gas varies with its volume when the mass and temperature of the gas are constant.
(a) On the same axes, sketch two additional curves A and B, if the following changes are made.
See graph: curve A below original, curve B above original (2 marks) (b) A cylinder of volume 0.20 m3 contains an ideal gas at a pressure of 130 kPa and a temperature of 290 K. Calculate:
(5 marks) (Total 7 marks) |
Follow me...
|


