'A' Level Medical Option Questions - The Ear
Q1.
The diagram shows a vertical section through the human ear. Solid bone is shaded grey.
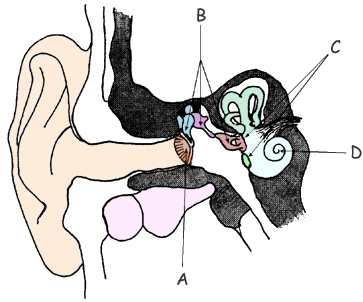
Name and state the function of the parts labelled A, B, C and D.
(Total 8 marks)

Q2.
(a) The threshold of hearing is quoted as 1.0 × 10–l2W m–2. Explain what is meant by the threshold of hearing and state the frequency at which the threshold has this value.
(2 marks)
(b) Sound intensity levels are usually measured in decibels. Give two reasons why this logarithmic scale is used.
(2 marks)
(c) Why was it necessary to introduce an adapted scale referred to as the dBA scale, which is used on some sound level matters?
(1 mark)
(d) Modern hi-fi equipment and televisions often have volume controls which allow the sound volume to be increased in steps. If each of these steps produces an increase in the sound intensity level of 2.0 dB, calculate
(i) the ratio by which the sound intensity is increased for each step up in volume,
(ii) the ratio by which the sound intensity is increased for a total of 10 identical steps up in the volume.
(4 marks)
(Total 9 marks)
Q3.
(a) State what is meant by the threshold of hearing and state the frequency at which the reference threshold is quoted.
(2 marks)
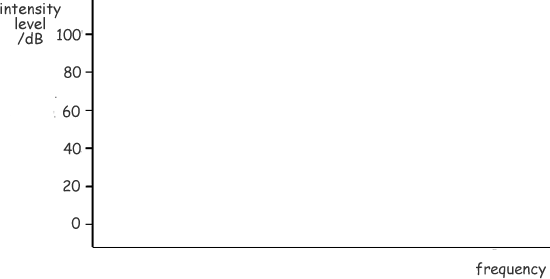
(b) Sketch a curve on the axes below to show how the threshold of hearing varies with frequency across the full range audible to a normal human ear. Add a suitable frequency scale to the frequency axis.
(5 marks)
(c)
(i) Calculate the intensity of a sound which is found to have an intensity level of 60 Db above the threshold of hearing. The intensity of the threshold of hearing is 1.0 × 10⁻¹²Wm–2.
(ii) The smallest increase in sound intensity which the human ear can detect is about 12%. Express this change in decibels.
(4 marks)
(Total 11 marks)
Q4.
(a) State two reasons why the logarithmic dB scale is used to compare sounds of different intensities.
(2 marks)
(b) Another scale used to compare sounds of different intensities is the dBA scale. What are the main differences between the dBA and the dB scales?
(3 marks)
(c) A reading of 94 dB is obtained on a sound meter placed near a drill. Calculate the intensity of the sound incident on the meter.
Reference threshold intensity I0 = 1.0 × 10⁻¹² W m–2
(3 marks)
(d) An identical drill is now placed next to the first drill and both are switched on. Calculate the new reading on the sound meter.
(2 marks)
(Total 10 marks)
Q5.
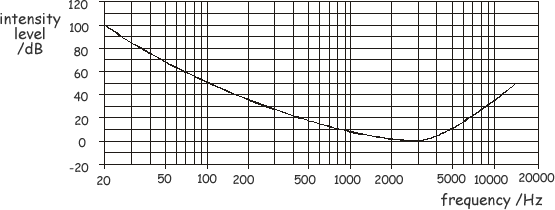
(a) The graph shows the equal loudness curve for the threshold of hearing.
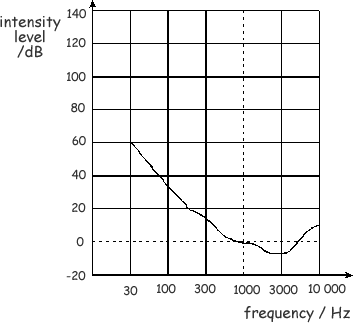
(i) On the diagram sketch the equal loudness curve which has an intensity level of 120 dB at a frequency of 1000 Hz. (120 phon)
(ii) What is the main similarity between the two curves?
(2 marks)
(b) On the axes below draw the curves for:
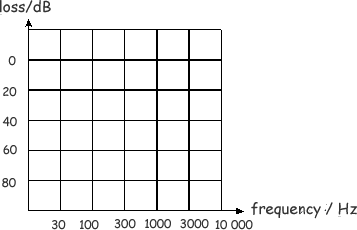
(i) age-related hearing loss and label it A,
(ii) noise-induced hearing loss and label it B.
(iii) What is the main difference between the two types of hearing loss?
(4 marks)
(Total 6 marks)
Q6. The diagram shows a vertical section through a human ear.
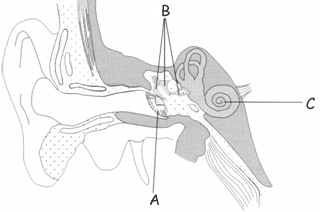
(a) Name and state the functions of the parts labelled A, B and C in the diagram.
(6 marks)
(b) An ear has a threshold of hearing at a particular frequency at an intensity level of 42 dB. Calculate the intensity of sound incident on the ear.
I0 = 1.0 × 10⁻¹² W m–2
(2 marks)
(Total 8 marks)
Q7. A ship sounds its foghorn. A person on a cliff hears the sound which has an intensity of 0.13 mW m–2. The sound suffered attenuation in travelling between the ship and the person.
(a)
(i) Define intensity.
(ii) State what is meant by attenuation and what causes it.
(3 marks)
(b) Calculate the intensity level of the sound heard by the person described above.
threshold of hearing I0 = 1.0 × 10⁻¹² W m–2
(2 marks)
(Total 5 marks)
Q8.
(a)
(i) State the main difference between the dB scale and the adapted dBA scale used to measure sound intensity levels.
(ii) A variable frequency sound source produces sound of equal intensity at all frequencies.
Two sound meters are placed equidistant from the source.
- One meter is switched to the dB scale.
- The other meter is switched to the dBA scale.
On the axes below sketch the response of the two sound meters as the frequency varies from 100 Hz to 10 000 Hz.
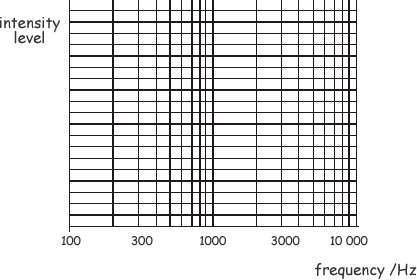
Label each curve dB or dBA.
(5 marks)
(b) A sound of intensity level 85 dB is incident on a human ear. The cross-sectional area of the ear canal is 65 × 10–6 m2. Calculate the power incident on the ear-drum. threshold intensity level, I0 = 1.0 × 10⁻¹² W m–2
(3 marks)
(Total 8 marks)
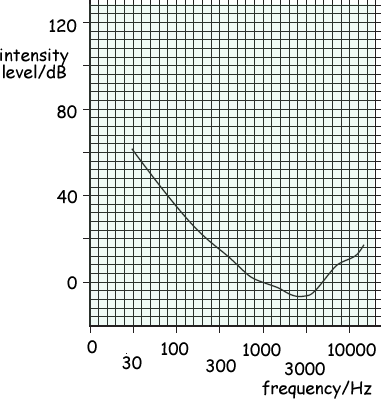
Q9. A patient has a hearing test to obtain an equal loudness curve at a level above the threshold of hearing. The curve obtained is shown below.
(a)
(i) Describe how such a curve is obtained.
(ii) On the graph draw an equal loudness curve which passes through 100 dB at a frequency of 1 kHz.
(5 marks)
(b)
(i) Define the threshold of hearing, I0
(ii) A drill is heard by a passer-by. The intensity of the sound reaching the passer-by is 1.3 × 10⁻³ W m–2. Calculate the intensity level of the sound heard.
I0 = 1.0 × 10⁻¹² W m–2
(4 marks)
(Total 9 marks)
Q10.
(a) State the frequency of sound at which the normal ear is most sensitive.
(1 mark)
(b) State the main features of hearing loss in terms of frequency response for
(i) age-related hearing loss,
(ii) noise-related hearing loss.
(2 marks)
(c) At the site of a machine in a factory, a sound meter was used to measure the sound level. The relative intensity level with the machine operating was 86 dB. The sound intensity reaching the meter when the machine was not operating was 7.0 × 10⁻⁵ Wm–2.
I0 = 1.0 × 10⁻¹² W m–2
(i) Show that with the machine operating, the sound intensity reaching the meter was about 4 × 10⁻⁴ Wm–2.
(ii) Calculate the relative intensity level due to the machine alone.
(4 marks)
(Total 7 marks)
Q11.
(a) Define the threshold of hearing, I0
(2 marks)
(b) A hearing test was used to obtain threshold hearing audiograms for several people. The audiogram shown below was obtained for a person with normal hearing.
On the audiogram:
(i) sketch a curve, labelled A, for a person suffering hearing loss due to old age
(1 mark)
(ii) sketch a curve, labelled B, for a person suffering hearing loss due to excessive noise
(2 marks)
(Total 5 marks)
Q12.
(a) A sound source of constant output power is used to generate a sound which is measured using a sound meter. When set to the dB scale, the sound meter displayed 60 dB as the reading when the frequency of the sound was 1 kHz.
(i) State and explain what the reading would be for a sound of frequency 1 kHz if the meter was changed to the dBA scale.
(1 mark)
(ii) State and explain what would happen to the reading on each scale if the frequency of the sound was changed to 500 Hz.
(2 marks)
(b) A drill is operated in an otherwise silent room. The drill produces sound of power 2.0 W which is given out equally in all directions. A sound meter is placed 5.0 m from the drill and is set to the dB scale. Calculate the reading on the sound meter.
I0 = 1.0 × 10⁻¹² Wm–2
(3 marks)
(Total 6 marks)
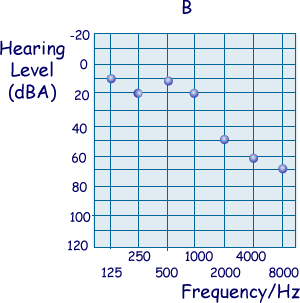
Q13. Three people are given routine hearing tests. The graphs below show the threshold hearing level of the patients at different frequencies. Graph A is for the patient with normal hearing.
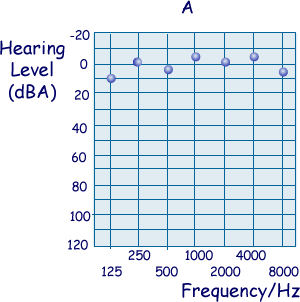

(a) State and explain one reason why the dBA scale is used.
(2 marks)
(b) Describe the significant difference between graph A and graph B, and suggest a possible cause.
(1 mark)
(c) Describe the significant difference between graph A and graph C, and suggest a possible cause.
(1 mark)
(Total 4 marks)


