'A' Level Medical Option Questions - The Ear
Q13. Three people are given routine hearing tests. The graphs below show the threshold hearing level of the patients at different frequencies. Graph A is for the patient with normal hearing.
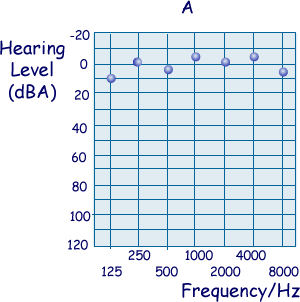

(a) State and explain one reason why the dBA scale is used.
The dBA scale gives a vitually flat response  across the whole frequency range of human hearing as it has been adjusted to take in the frequency response of the human ear. The variation with which we detect sounds of the same intensity across the spectrum of hearing has been compensated for.
(2 marks)
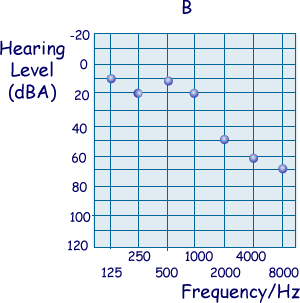
(b) Describe the significant difference between graph A and graph B, and suggest a possible cause.
Loss in hearing increases as frequency increases, this type of loss is due to old age
(1 mark)
(c) Describe the significant difference between graph A and graph C, and suggest a possible cause.
The loss in hearing increases up to 4 kHz and then decreases after this. There is a maximum loss at 4 kHz. This type of loss is because the person has been subjected to excessive noise - loud sounds.
(1 mark)
(Total 4 marks)


