Characteristic Curve of a Filament Lamp

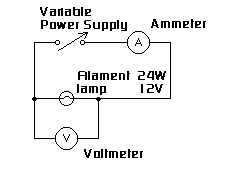
A circuit was set up as
shown in the diagram. The bulb used was marked '24W 12V'
The potential difference
across the bulb was varied from 0V to 12V and voltmeter and ammeter
readings and observations were recorded in a table.
|
Potential
Difference
/ V
|
Current
/A
|
|
Observations
|
|
0.0
|
0.00
|
|
Filament does not
glow at all (Bulb feels cold)
|
|
0.2
|
0.21
|
|
|
|
0.4
|
0.40
|
|
|
|
0.6
|
0.51
|
|
|
|
0.8
|
0.58
|
|
|
|
1.0
|
0.61
|
|
Faint glow can
be seen
|
|
2.0
|
0.82
|
|
Filament glows
a dim red (bulb feels warm)
|
|
3.0
|
0.95
|
|
Filament bright
red (bulb is hot)
|
|
4.0
|
1.12
|
|
Filament orange
|
|
5.0
|
1.28
|
|
Filament brilliant
orange
|
|
6.0
|
1.44
|
|
Filament even brighter
- now yellow (bulb is very hot to touch)
|
|
7.0
|
1.53
|
|
Filament yellow/white
|
|
8.0
|
1.63
|
|
|
|
9.0
|
1.74
|
|
Filament bright
white light
|
|
10.0
|
1.85
|
|
|
|
11.0
|
1.94
|
|
|
|
12.0
|
2.06
|
|
|
-
Copy the above table
of results into your notebook.
-
Label the blank column
'Power dissipated' in your table of results and calculate
the power dissipation for the lamp by using the equation P=IV.
(Make sure you put the correct unit in the table column heading!)
-
Plot a graph of
potential difference across the bulb against current flowing
through it.
-
What range of voltages
will produce the biggest change in temperature of the bulb?
-
Why do you think
the students carrying out this experiment decided to investigate
the voltages between 0V and 1V in more detail?


