Practical Experiment Report Writing
Using Graphs
 Dealing
with Errors when Using Graphs
Dealing
with Errors when Using Graphs
Gradient
of a straight line
Gradient
of a curve
Intercept
Plotting graphs
Relationships involving powers
Straight line graph
The
straight line graph
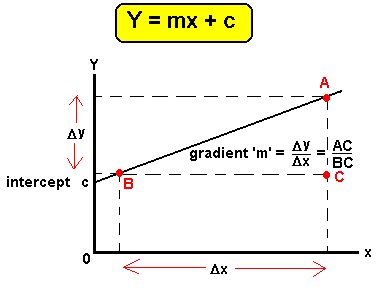
The general form of a linear
equation is y = mx + c in which y is taken to be the dependent and x the
independent variable; this is the one that you vary. with m and c being constants. The gradient of the line. which may be negative, gives the value
of m whilst the intercept on the vertical axis gives the value of c.
A graph is used to summarise data in
a pictorial way such that the main features of the relationship under investigation
can be seen. Since linear relationships are easier to 'see' the straight line
graph is of great importance in physics.
Plotting
graphs
In order to extract
the maximum of reliable data from a graph it is important to make full use of
the graph paper,
 Whenever
it is available make use of 1mm A4 graph paper but in all case use A4 graph paper
Whenever
it is available make use of 1mm A4 graph paper but in all case use A4 graph paper
When choosing a scale for the graph
ensure your data covers at least 8cm by 8cm on that scale
When finding the gradient make sure that you use the largest possible values for
Δx and Δy.
Include error
bars and / or least and greatest gradient lines
Do not forget the units for m and c
The
intercept
For an equation
of the form y = mx + c when x = 0 then y equals c
WARNING!
If
the x-axis does not start at x = 0
then
the intercept on the y-axis WILL NOT give the value of c.
Sometimes
in order to generate a more sensible scale it is better not to start at x = 0
but the above warning must then be remembered.
The y-axis does not, however, need
to start at y = 0 in order to obtain the value of c from the intercept
The
gradient
If we consider the
equation y = mx + c then we can transpose to give;
m =(y-c) / x
You
should also notice that the gradient is given by
change in gradient = change in y value change in x value
OR
gradient = Dy/Dx
Relationships
involving powers
Not all
of the relationships you investigate will be linear in nature, many will be of
the form y = kxn where k and n are constants. Plotting a graph
of y and x would produce a curve which would not allow k or n to be found.
This can be resolved be the use of logs.
y = kxn
log y = log k + n (log x)
or
log y= n log x + log k
this
is now in the form of
y =mx +
c
So,
if you now plot log y on the vertical axis and log x on the horizontal a straight
line will be produced which will allow 'n' to be found from the gradient and log
k to be found from the intercept. This, in turn, allows k to be found.
When you plot a log graph the log values
need to be tabulated; note that log values do not have units.
|
P.D. (V)
|
log (P.D./V)*
|
current
(A)
|
log (current/A)*
|
|
20.0
|
1.30
|
0.60
|
- 0.22**
|
|
40.0
|
1.60
|
1.6
|
0.20
|
|
60.0
|
1.78
|
3.3
|
0.52
|
|
80.0
|
1.90
|
4.9
|
0.69
|
|
100
|
2.00
|
6.5
|
0.81
|
The
gradient of a curve
Rather than draw
a log graph to turn a curve into a straight line it is sometimes useful to use a curve in order to more readily see the trend of the results.
Information
is sometimes required that means finding the gradient of the curve at a given
point.
This is done by drawing a tangent to the curve at that point. A tangent
only touches the curve at that one point and is said to be 'perpendicular to the
normal of the curve at that point'
Drawing
tangents is often utilised in work involving varying rates.
Dealing
with Errors when Using Graphs
When
a graph of the form y = mx + c is plotted it produces a straight line.
The gradient of such a graph is m and the intercept c. These values are
often the quantities we are trying to find in our investigation and as such some
estimation of the error in them needs to be made.
The
best fit line is used to give a measurement of the gradient and intercept.
This
must be shown in your coursework.
However if we wish to estimate the error then
we can draw the two additional lines:
- one the steepest possible through the points and
- one at the shallowest gradient.
The gradient of the steeper
of the two is called Mmax and the other Mmin.
The
error in the value of m can be estimated as
Dm = ½ (Mmax- Mmin )
Therefore the value quoted for the gradient is m ± Dm
The error in the intercept can be treated
in the same way giving
Dc
= ½ (cmax- cmin )
Hence
this value is recorded as c ± D c

Obviously you need to keep a careful eye on
the number of significant figures used and also try to make sure that you
don't include any points which are known to be in error.
If a point seems
to be too far away from the trend shown by the others either go back and check
it or consider leaving it out. If you leave it out of your graph you should still
record it in your results table and comment on why you have omitted it from the
graph.
The
values for the quantities on the x and y axes will have an error associated
with them and this can be shown on the graph by the use of error bars. Rather
than simply plotting a point lines are added to show the error range.


