Practical Experiment Report Writing
Presenting
Results in a table
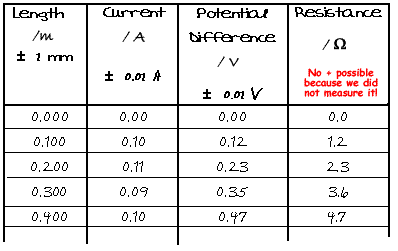
Tables
should always be used to present results. A table has border lines around it - you should not give a 'list of results' but a 'table of results' 

There
should be a headed column for
 each
set of readings taken (never omit these!)
 each
set of calculated values from the experimental data (these may be derived for
you to calculate values or plot a graph)
Headings should
 be at
the top of a column of numbers (this is preferable to on the left of a series
of results).
 give the physical quantity measured in words (eg. current, potential difference,
length, time) . Abbeviations (I,
V, l, t) can be used only if it is clear what they stand for in the text - it
is best to include both!.
 include the unit the physical property is measured in. This should preferably
be the S.I. unit (as this is the one that will be required in calculations).e.g.
Current I (A)
 have an
indication of the error involved in taking the reading (if applicable). This can
be given as a + value or percentage
 have
border lines drawn around them.
Columns should
 contain
only numerals (Your units are at the top already.... it would be a mistake to
put them in again!)
 contain
numbers to the correct number of significant figures. This should indicate the
accuracy to which you can read the instruments you have used. (e.g. 0.20 m indicates
a reading taken to the nearest cm whereas 0.2 cm indicates you can only read to
the nearest 10 cm and 0.200 m to the nearest mm). Therefore a column representing
a set of readings taken with the same instrument should all have the same number
of significant figures.
 have
border lines drawn around them

Word-processing results can lead to errors.
You should be very careful to check your final draft
carefully
Common
errors that lose you marks:
 Using
the wrong font: remember the symbol allows you to put in greek letters such as W, n, and m.
 Puting
numbers in to the wrong number of significant figures (especially if worked out
on a spreadsheet without thought to formatting the numbers in the column.
 Missing
out the columns with readings taken - only including columns needed to calculate
the conclusion value or plot a graph is a major error - you must include the columns
of results you took during the experiment!
 Incorrectly
calculated derived values because you have put in the wrong formula - always check
at least two values in a 'fill down' column with your calculator!
 Not
drawing a border - making it a list of numbers not a table of results.


