Heat Questions - GCSE Level
Q15. A householder monitored how the air temperature inside his house changed over a two hour period. The householder measured the temperature every 15 minutes.
The graph shows how the temperature changed with time.

(a)
(i) The householder used a digital thermometer to measure the temperature. Which of the following intervals would be an appropriate resolution for the digital thermometer?
0.5 °C 
[1 mark]
(ii) The householder's results are shown above on a line graph. Why would it not be appropriate to use the results to plot a bar chart?
The data is continuous or both variables are continuous or independent variable is continuous or time is continuous.
[1 mark]
(b) The householder's heating is controlled by a thermostat. The thermostat switches the heating on when the temperature decreases below a certain temperature.
(i) At what temperature does the thermostat switch the heating on?
20.5 °C
[1 mark]
(ii) Use the graph to determine the number of minutes that the householder's heating was switched on between 07:00 and 09:00.
60 minutes
[1 mark]
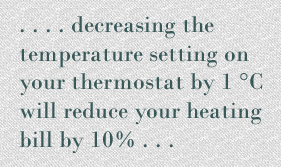
(c) The householder read the following extract from a newspaper article about reducing energy use in the home:
On Monday, the householder set his thermostat at 20.0 °C and recorded the energy, in kWh, used to heat his house.
On Tuesday, the householder set his thermostat at 19.0 °C and recorded the energy, in kWh, used to heat his house.
The table below shows the results of the householder's investigation:
Thermostat setting in °C |
Energy in kWh |
20.0 |
8.0 |
19.0 |
7.2 |
(i) The outside temperature was the same on both days.
Give one reason why this was important.
So a fair comparison can be made of the temperature changes or because the outside temperature is a control variable
[1 mark]
(ii) Explain how the results shown in the table support the extract from the newspaper article.
Justify your answer with a calculation.
Cost = the number of kWh x the cost per kWh
Saving = 8.0 - 7.2 = 0.8 kWh
0.8 / 8.0 = 0.1 or 10% savings
[2 marks]
(iii) The statement in the extract is not valid for all situations. Suggest why.
Heating can be on for more / less time (than anticipated) because some days it is cooler / warmer (than anticipated)
[2 marks]
(9 marks total)


