GCSE Questions: Forces
Q12. A lorry driver sees the traffic lights at a road junction change to red. The driver applies the brakes to stop the lorry. The stopping distance of the lorry is the sum of the thinking distance and the braking distance.
(a)
(i) Tick the statement in the table below that best describes the thinking distance:
Statement |
Tick here |
The distance the lorry travels during the driver's reaction time. |
|
The distance the lorry travels once the brakes are applied. |
|
The time it takes the driver to react and apply the brakes. |
|
The time it takes for the lorry to stop after the brakes are applied. |
|
[1 mark]
(ii) How does thinking distance depend on the speed of the lorry?
The greater the speed of the lorry the greater the thinking distance will be, as the distance travelled in the time it takes for the driver to react is directly proportional to the speed.
[1 mark]
(b) The graph below is a plot of how the velocity of the lorry changes from just after the driver sees the traffic lights change to red.
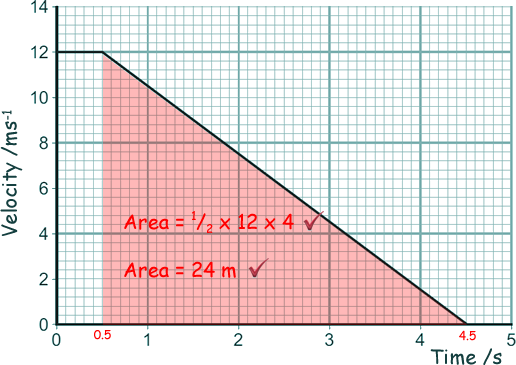
(i) Use the graph to calculate the braking distance of the lorry in metres.
[2 marks]
(ii) The work done by the brakes to stop the lorry is 360 kJ.
Calculate the braking force used to stop the lorry.
Work done = Force x distance moved in the direction of the force
W = Fd
Work done = 360 kJ = 360,000 J
360,000 = F x 24
F = 360,000/24
F = 15,000 N
[4 marks]
(c) Anya investigated how braking distance depends on braking force. Here is a diagram os the apparatus she used.
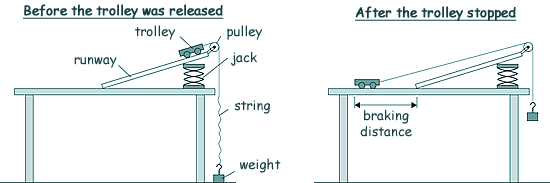
Anya released the trolley from the top of the runway. When the trolley reached the bottom of the runway the string became taut and the trolley started to lift a weight from the floor. The weight being lifted was equal to the braking force on the trolley. She recorded the weight and the braking distance.
Anya then repeated the experiment several times, changing the weight being lifted, and measuring the new braking distance.
(i) State one control variable in this investigation.
Any one from:
height (of the ramp)
speed of the trolley at the bottom (of the ramp)
angle (of the ramp)
start point (on the ramp)
[1 mark]
(ii) The diagram shows the braking distance she measured. What else could Anya have measured that would also have given the braking distance?
She could measure the maximum distance the weight is lifted from the floor.
[1 mark]
(iii) Measuring each braking distance at least twice would improve the investigation.
Suggest why.
It would increase the accuracy in measurement of braking distance or increase the reliability of the measurements
by allowing
a mean/average to be calculated or anomalous results to be discarded.
[2 marks]
(iv) The results of Anya's investigation are plotted as a graph below:
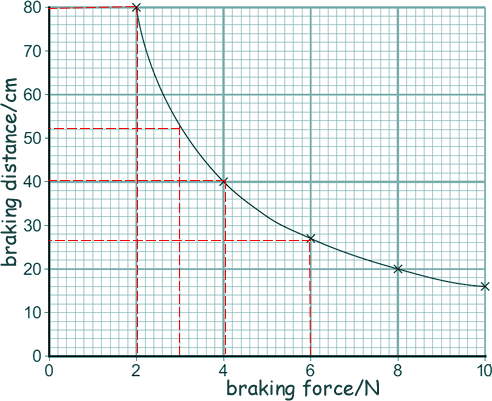
Using the data plotted, what conclusions do you think should be made from this investigation about the relationship
between braking distance and braking force?
As braking force increases braking distance decreases
For example - increasing the force from 2N to 8N (increase by a factor of four) you can decrease the braking distance from 80cm to 20 cm (decrease by a factor of four)
[2 marks]
[14 Marks TOTAL]


