
 |
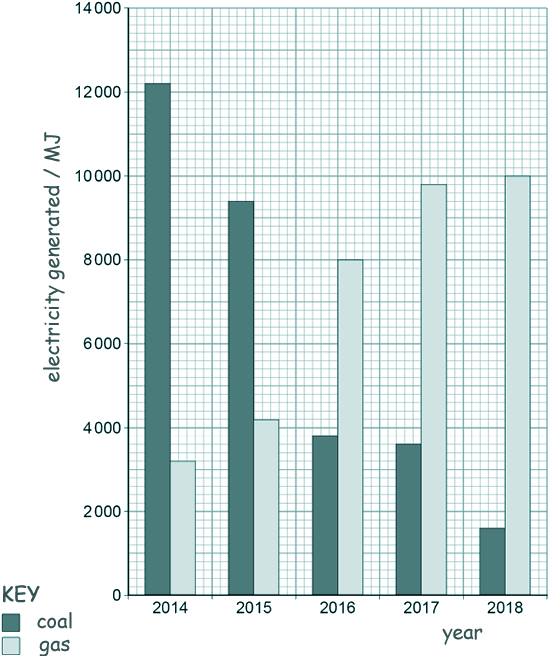
GCSE Questions: Energy Sources Q22. The bar graph shows how much electricity was generated using coal-fired and gas-fired power stations in January for 5 years in the UK - from 2014 - 2018.
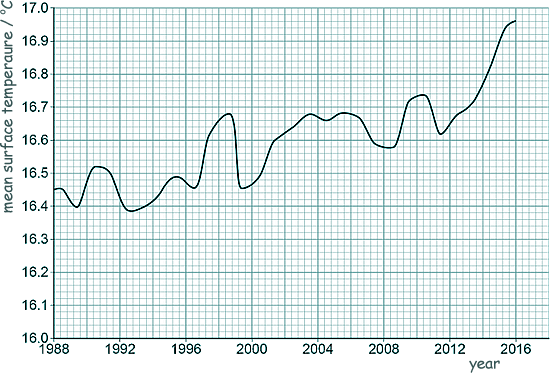
(a) Determine the percentage increase in electricity generated using gas-fired power stations from 2014 to 2018. [2 marks] (b) Give two environmental advantages of using a gas-fired power station to generate electricity compared with using a coal-fired power station. [2 marks] (c) The mean surface temperature of the sea changes throughout the year. A change in the mean surface temperature from year to year indicates climate change. The graph below shows how the mean surface temperature changed between 1988 and 2016.
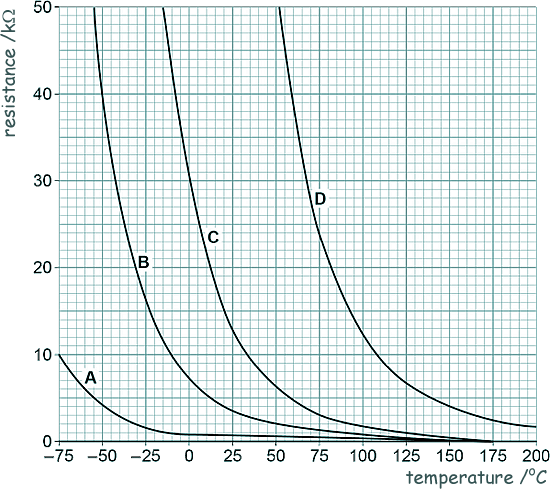
Donald does not believe that climate change is occurring. Explain how the data in the above graph suggests he is wrong. [2 marks] (d) A thermistor can be used to measure temperature. The graph below shows how the resistance of four different thermistors A, B, C and D, varies with temperature.
Which of the four thermistors would be the most suitable to measure the surface temperature of the sea? Explain your answer. [3 marks] (Total 9 marks)
|
Follow me...
|


Cyberphysics - a web-based teaching aid - for students of physics, their teachers and parents....
