GCSE Questions: Energy Sources Q20. (a) The diagram shows how the National Grid connects power stations to consumers.
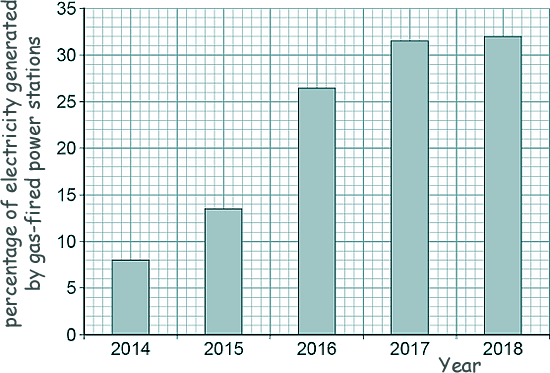
Name the parts of the National Grid labelled K, L and M. [3 marks] (b) The bar graph shows how the percentage of electricity generated by gas-fired power stations changed in the UK over the five years from 2014 - 2018.
Calculate how many times greater the percentage of electricity generated by gas-fired power stations was in 2018 than in 2014. [2 marks] (c) Explain one environmental effect of generating electricity using a gas-fired power station. [2 marks] (d) The UK government wants more electricity to be generated using renewable energy resources. Choose from the four defiitions below the one that best explains what a renewable energy resource is. Tick your choice.
(e) An offshore wind farm is a group of wind turbines that are placed out at sea. The graph below shows the power output of an offshore wind farm compared with a wind farm on land for a 24-hour period.
Give two advantages of the offshore wind farm compared with the wind farm on land. Use information from the graph. [2 marks] (Total 10 marks) |
Follow me...
|


