
 |
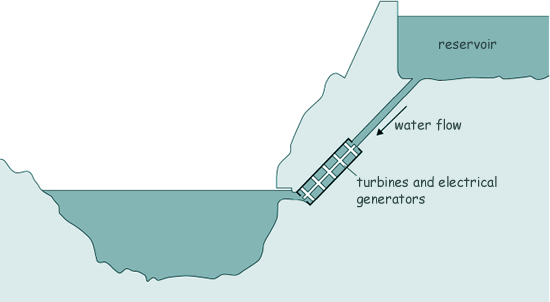
GCSE Questions: Energy Sources Q21. Here is a hydroelectric power station.
(a) Electricity is generated when water from the reservoir flows through the turbines.
[1 mark]
[4 marks]
[1 mark]
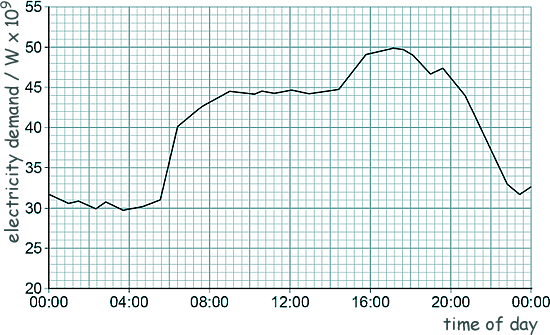
[3 marks] (b) The graph below shows how the UK demand for electricity increases and decreases during one day.
The hydroelectric power station in the diagram above can provide 1.5 × 10⁹ W of power for a maximum of 5 hours. Give two reasons why this hydroelectric power station is not able to meet the increase in demand shown between 04:00 and 16:00 in this graph. The variation in demand is much greater than 1.5 × 10⁹ W [2 marks] (Total 11 marks) |
Follow me...
|


Cyberphysics - a web-based teaching aid - for students of physics, their teachers and parents....
