GCSE Standard Questions: Electric Circuits
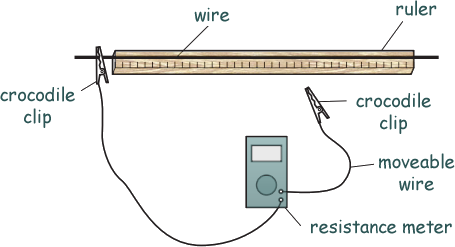
Q12. Barry and Cisco investigate the resistance of a wire. They tape a length of wire to a metre ruler and connect it to a resistance meter using crocodile clips.
Take a look at their results.
| Length of wire (cm) |
Resistance (Ω) |
Attempt 1 |
Attempt 2 |
Attempt 3 |
Mean |
25 |
8.8 |
8.3 |
8.5 |
8.533 |
50 |
16.2 |
16.1 |
16.4 |
16.4 |
75 |
23.5 |
23.8 |
18.7 |
23.7 |
100 |
30.8 |
31.1 |
31.0 |
31.0 |
(a)
(i) Describe the pattern shown by these results. Use data in your answer.
The reults indicate a proportional relationship  - as the length of the wire increases the resistance increases. In fact it is a directly proportional relationship - as length doubles from 25 cm to 50cm , resistance roughly doubles from about 8Ω to about 16Ω andas length doubles from 50 cm to 100cm , resistance roughly doubles from about 16Ω to about 31Ω ).
[2 marks]
(ii) The students made two mistakes when they recorded their results and completed the table. Identify the mistakes and explain what they should have done.
 the mean for 25cm is recorded to 3 decimal places (or 4 sig figs) and it should be recorded to one decimal place (or 2 sig figs) as 8.5 Ω
the mean for 50cm is incorrect and it should be 16.2 Ω
[2 marks]
(iii) The students have correctly handled an anomaly in their results.
Identify the anomaly and explain how it was correctly handled.
The 75cm attempt number 3 of 18.7Ω (is an anomaly).
However, it has not been included in the calculation of the mean value - so has been dealt with correctly.
[2 marks]
(iv) The students plan to plot a graph of mean resistance against length. What would you expect a graph of these results to look like?
I would expect the graph line to be straight line that passes through the origin.
[2 marks]
(b)
(i) The actual mean resistance values are more than expected. Suggest two possible errors with the experiment.
Any two from:
(extra resistance due to ) connecting leads being too long or too thin
(extra) resistance of the croc clips because the crocodile clips are rustyor poor connections because of bad or loose connections
croc clip is not at 0cm/the end of the ruler meaning that the measured length of resistance wire longer than intended
heating effect of wires
parallax error on the meter (if it is analogue) and/or meter not properly calibrated (so resistance reads higher/lower than it should be).
[2 marks]
(ii) For one of the errors, suggest how the experimental procedure could be improved.
Any one from:
make the connecting wires as short as possible
keep croc clips clean or solder the connections
place croc clip exactly at the end of the ruler - at 0cm
use thicker connecting wires
ALLOW let wire(s) cool between readings
Securely fix croc clip
calibrate meter / avoid parallax error
[1 mark]
(Total 11 marks)


