Solutions: Radioactivity Questions
Q7.
(a) Sketch a graph to show how the number of neutrons, N, varies with the number of protons, Z, for stable nuclei over the range Z = 0 to Z = 80. Draw a scale on the N axis.
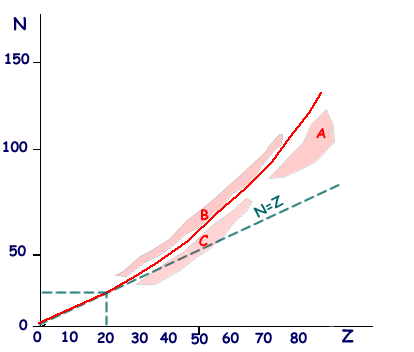
straight line between (Z = 0, N = 0) to (Z = 20, N = 20)  curving upwards to Z = 80; N = 110 –130
(2 marks)
(b) On the same graph, enclosing each region by a line, indicate the region in which nuclides are likely to decay, by
(i)  emission, labelling the region A,
A = any region below the line of stability but N > 80 and Z > 60
(ii)  emission, labelling the region B,
B = any region above and close to the line of stability
(iii)  emission, labelling the region C.
C = any region below and close to the line of stability
(3 marks)
(c) Complete the table.
mode of decay |
change in proton number Z |
change in neutron number N |
emission |
–2 |
-2 |
emission |
+1 |
-1 |
emission |
-1 |
+1 |
e- capture |
-1 |
+1 |
p emission |
-1 |
0 |
n emission |
0 |
-1 |
lose one mark for each row in error
(3 marks)
(8 Total Marks)


