A level: Kinetic Theory Questions
Q6.
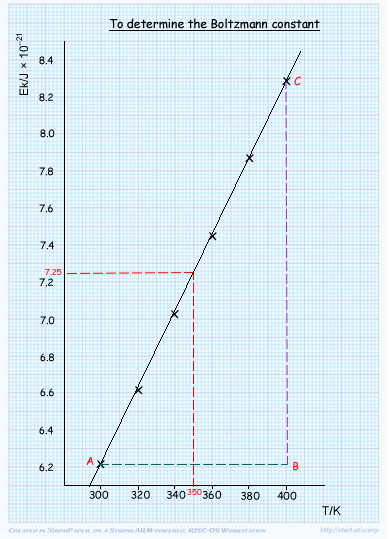
The table gives the average kinetic energy of gas molecules at certain temperatures.
Ek/J × 10–21 |
6.21 |
6.62 |
7.04 |
7.45 |
7.87 |
8.28 |
T/K |
300 |
320 |
340 |
360 |
380 |
400 |
(a) On a sheet of A4 graph paper plot a graph of Ek against T.
Suitable scales to maximise the use of the graph paper, units on axis
correct points (plotted within ½ square)
best fit line (drawn with ruler)
(i) Use your graph to determine the average kinetic energy of gas molecules at 350 K.
Ek at 350 K = (accept 7.23 to 7.27) × 10–21 J
(ii) Determine the gradient of your graph and hence calculate a value for the Boltzmann constant. Show all your working.
 y/x = CB/AB
= (8.28 - 6.21) x 10-21/(400 - 300)
= 2.07 x 10⁻²¹/100
= 2.07 x 10⁻²³ J/K
(accept 2.00 x 10⁻²³ to 2.15x 10⁻²³)
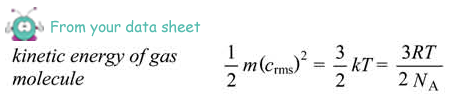
so, EK = 3/2kT
relating this to Y= mx + c we see that the gradient of our graph of Ek against T is equal to 3/2k
k = 2/3 x gradient
= 2/3 x 2.07 x 10-23
= 1.38 ×10⁻²³ J K–1
(8 marks)
(b) One of the assumptions of the kinetic theory is that collisions of gas molecules are elastic.
(i) State what is meant by an elastic collision.
In an elastic collision kinetic energy is conserved.
(ii) State another assumption of the kinetic theory.
Any one from:
- time of collision is negligible (compared to time between collisions)
- large number of molecules,
- volume negligible (compared to volume of container),
- no intermolecular forces,
- rapid random motion of particles
(iii) Explain how the data in the table leads to the concept of absolute zero.
A sketch graph of Ek vs T/K gives a straight line because temperature is proportional to Ek. If the graph was expanded we would get a line that went through the origin and at 0 K, Ek would be zero
(4 marks)
(Total 12 marks)


