GCSE level optics questions
Q11.
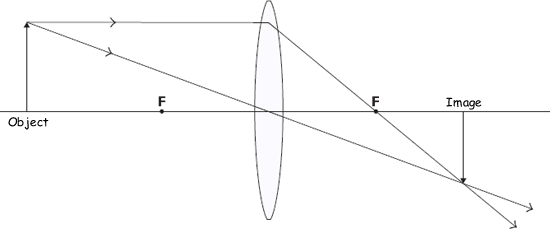
The diagram shows a lens, the position of an object and the position of the image of the object.

(a) What type of lens is shown?
(1 mark)
(b) What is the name of the points, F, shown each side of the lens?
(1 mark)
(c)
(i) The image is real and can be put on a screen. How can you tell from the diagram that the image is real?
(1 mark)
(ii) Draw a ring around a word in the box below which best describes the image produced by the lens.

(1 mark)
(d) A student investigates the relationship between the distance from the object to the lens and the magnification produced by the lens. The student's results are given in the table. The student did not repeat any measurements.
Distance/mm |
Height of object/mm |
Height of image/mm |
Magnification
produced
|
40 |
20 |
58 |
2.9 |
50 |
20 |
30 |
1.5 |
60 |
20 |
20 |
1.0 |
70 |
20 |
14 |
0.7 |
80 |
20 |
12 |
0.6 |
90 |
20 |
10 |
0.5 |
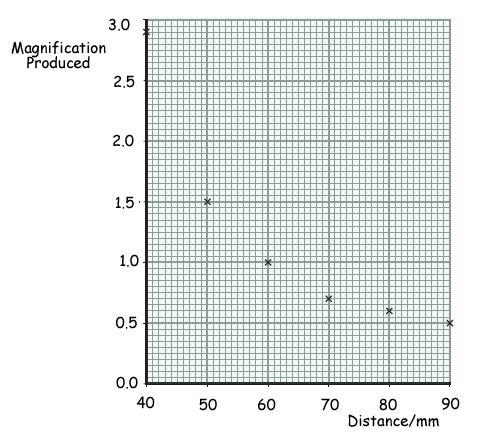
The student plots the points for a graph of magnification produced against distance.

(i) Draw a line of best fit for these points.
(1 mark)
(ii) Complete the following sentence by drawing a ring around the correct word in the box. "A line graph has been drawn because both variables are described as being ...."

(1 mark)
(iii) Describe the relationship between magnification produced and distance.
(2 marks)
(Total 8 marks)


