Rate
of Radioactive Decay
The rate
of decay is the number of radioactive atoms that emit nuclear
radiation in one second. This is effectively the same as the activity
of the sample. It is measured in becquerel
(Bq).
It is sometimes referred to as the 'count' for a sample.
You should
realize that the geiger counter only gives an indication of the activity
as it does not detect ALL particles - only a proportion of them! Changing
the setting on the meter changes the 'count' but not the activity it
is measuring. When doing an experiment it is important not to change
the settings on your counter - keep them the same! You can then make
valid comparisons.
The decay Constant
( ) )
The rate of decay
or activity (A) depends on the number of radioactive atoms present.
It is proportional to the number that have not yet decayed in the sample.
The constant of proportionality is called the decay constant and given
the symbol λ (lamda).
A = λn
The decay constant
is characteristic to each radioactive isotope. It is the probability
of a decay occurring. We can calculate the expected activity of a sample
if we know its size and decay constant. The half life of a radioactive
isotope is inversley proportional to the decay constant.
T1/2
= ln2/
Half
Life
The activity of radioisotopes
decreases exponentially with time. After a given time period the amount
that has yet to decay is halved. This is the case no matter when you start
to measure the activity of the sample. The time taken for this 'halving'
of activity is called the half-life.
Half-lives vary widely
from microseconds to millions of years!
Uranium-238 has a
half-life of 4.5 x 10⁹ years (4,500,000,000 years) whereas
Polonium-212 only has a half-life of 3 x 10⁻⁷ seconds (0.000
000 3 seconds). Also the tables of isotopes in the decay
series section show a wide variation in half-lives.
Working out a half-life
is best explained with an example:
Well, it would take:
 one half-life
for the activity to drop from 640 Bq to 320 Bq one half-life
for the activity to drop from 640 Bq to 320 Bq
a second
half life for the activity to drop to 160Bq
a third
for it to drop to 80Bq
a fourth
for it to drop to 40 Bq
a fifth
for it to drop to 20 Bq
a sixth
for it to drop to 10 Bq
and a seventh
for it to drop to 5 Bq
So it would take seven
half lives for the activity to drop from 640 Bq to 5 Bq. The time for
this to happen was 14 minutes so the half-life must be 2 minutes.
Sometimes questions
include a value for the background
rate. This is the rate of activity
that is due to background radiation
NOT the sample and must therefore be deducted before any calculations
are done.
Initial count-rate
due only to the sample was (102-6) Bq = 96 Bq
Final count-rate due
only to the sample was (12-6) Bq = 6 Bq
Well, it would take:
one half-life
for the activity to drop from 96 Bq to 48 Bq
a second
half life for the activity to drop to 24 Bq
a third
for it to drop to 12 Bq
a fourth
for it to drop to 6 Bq
So it would take four
half lives for the activity of the sample alone to drop from 96 Bq to
6 Bq. The time for this to happen was 10 minutes so the half-life
must be 2.5 minutes.
Questions of this
type are not uncommon at GCSE
This topic requires
the drawing and interpretation of graphs, so although it is suitable to
use with spreadsheets on a computer, time needs to be spent ensuring that
the work can be done by the pupils in an exam room too.
It is a useful rule
of thumb to know that the activity of a sample drops to less than 1% of
its value in seven half lives (see Tc99-m)
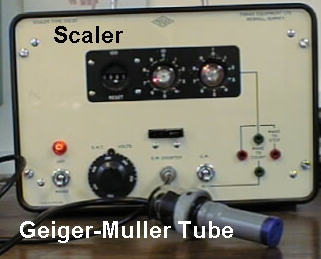
The
activity of a sample can be measured with a Geiger-Müller
tube connected to a rate-meter or by connecting it to a scaler and
timing how long you allow the scaler to count for.
See site below for
diagram of how a Geiger-counter works
http://www.atomicrocks.com/html/geiger.html
If the activity of
a sample is plotted against time, an exponential curve is obtained.
(NB
It must be the true activity - with the background count deducted
from each reading. If you are given a 'corrected count rate' that has
already been done for you!)
Examination questions
often occur on this topic. When plotting a graph, examiners like
to see candidates:
- Make maximum
use of the graph paper (choose the best scale - have paper orientated
the correct way so as to do this)
- Label axes
with physical quantity and correct units
- Mark the
points clearly. A neat cross is better than a 'blob'.. most computer
programs go for 'blobs'.
- Draw the
line of best fit. If the points indicate a curve, it should be
smooth (not 'dot-to-dot' like in a puzzle book). If they indicate
proportionality the line should be drawn with a ruler.
- Work should
be neat (sharp pencil, long ruler, axes in ink etc.)
When analysing data
from a graph (whether drawn by them or given to them) candidates must
clearly show how the graph was used.

When dealing with radioacive materials inside a human body we have to look at the effective half life, rather than just the physical one.
|


 Half
Life and Rate of Decay
Half
Life and Rate of Decay