    |
||||

Photoelectric Effect - Stopping Potential |
||||
|
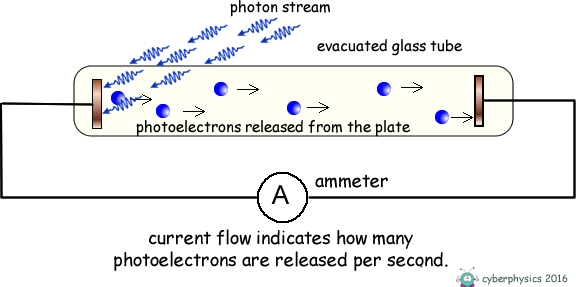
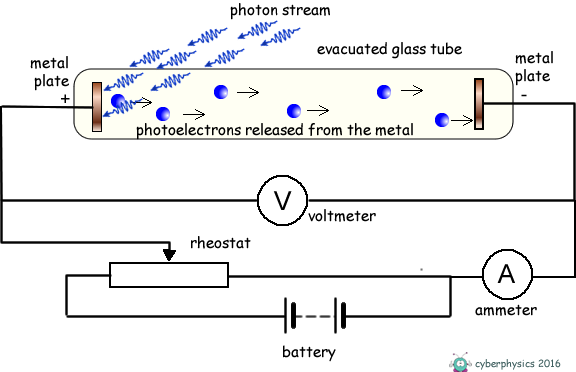
Consider an evacuated glass tube containing two metal plates.
If we illuminate one of the metal plates with photons of energy above the work function value of the metal, electrons absorb the photons and escape from the surface of the metal. As the plate is within an evacuated tube these electrons will move off the surface with whatever kinetic energy they possess, in whatever direction they are emitted and travel without interacting with air molecules. Some will move across the tube and hit the metal plate at the opposite end of the tube and the ammeter will register a current. The current gives no indication of the kinetic energy of the photoelectrons only the number of them released per second. The energy they posess is kinetic energy. If that energy is transferred into potential energy by applying an electric feild to oppose their motion we can work out what that initial kinetic energy was. We therefore apply an electric voltage across the tube to oppose the travel of the electrons between electrodes. The energy supplied to the electrons by the electric field = eV We make the illuminated electrode positive and the one they are travelling to negative and therefore repulsive to the electrons.
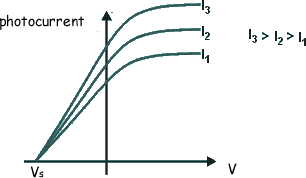
If the voltage applied is too weak the current flow will not stop, just decrease. We therefore gradually increase the applied voltage until the photocurrent becomes zero. The voltage that has to be applied to do this is called the 'stopping voltage'. It is given the symbol VS
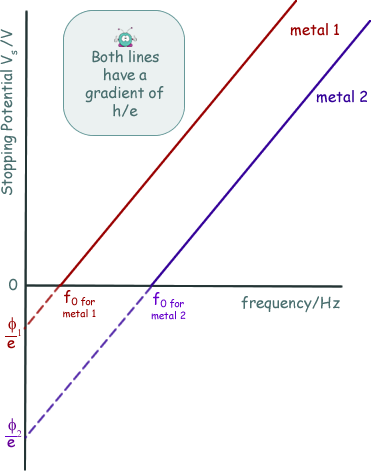
The energy supplied to the electrons by the electric field to exactly counter their kinetic energy = eVS EK = eVSNow, we know that hf = φ + EK(MAX) so we can now write: hf = φ + eVS rearranging this we get: eVS = hf - φ This has the form of a straight line graph. Therefore if we perform an experiment, varying the frequency of the light we use to illuminate the metal plate and measuring the corresponding stopping potential we can present our results in graphical form. Extrapolating the graph will give us the intercept on the Y-axis. This negative intercept will give us the work function of the metal and the gradient of the graph will give us the Planck constant. Most of the time the graph plotted is not of eVS against f, but of VS against f.... then the gradient will be h/e and the intercept -φ/e
|
||||
 |
||||


