|
Question 1
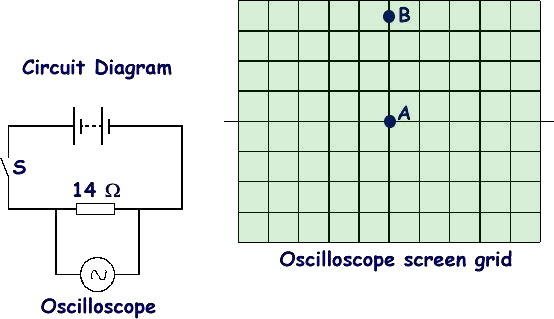
(a) An oscilloscope is connected across a battery as shown in the diagram.

The time base of the oscilloscope is switched off throughout the experiment.
Initially the switch S is open. Under these conditions the spot on the oscilloscope screen is at position A.
Switch S is now closed. The spot moves to B. The voltage gain setting of the oscilloscope is 0.50 V /division.
(i) What does an oscilloscope measure?
Potential difference (voltage) as it varies with time.
(1 mark)
(ii) What value does the movement of the spot from A to B represent?
3.5 divisions (1 mark)
represents 3.5 x 0.5 = 1.75 V (1 mark for answer 1 mark for unit)
(3 marks)
(iii) Given that:
Potential difference (volts) = current (amps) x resistance (ohms)
calculate the current that is flowing through the resistor.
current = V/R (1 mark)
= 1.75/14
= 0.125 A (2 marks - 1 for answer - 1 for unit)
(3 marks)
(b) The time base is now switched on. What would you see on the screen:
(i) When switch S was open
A horizontal line (1 mark) through where spot A used to be. (1 mark)
(ii) When switch S was closed.
A horizontal line through where spot B used to be. (1 mark)
(3 marks)
(c) The oscilloscope is disconnected from the battery and connected across a mains voltage supply - an alternating voltage source of rms value 230 V and peak value of 330V.
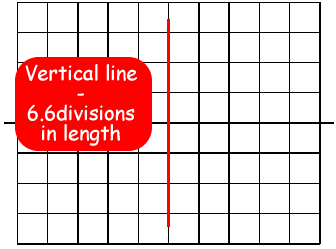
(i)  Sketch the grid on the right and draw what you would expect to see on the oscilloscope screen, if the time base is switched off and the voltage sensitivity is altered to 100 V /div. Sketch the grid on the right and draw what you would expect to see on the oscilloscope screen, if the time base is switched off and the voltage sensitivity is altered to 100 V /div.
Line goes peak to peak (twice amplitude = 660V) = 6.6 divisions
vertical line gets one mark - centred on the mid line (1 mark)
6.6 divisions in length (3rd mark)
(3 marks)
(ii) Describe what you would see on the screen if the timebase was then switched on.
A sinusoidal curve (you could sketch the shape).(1 mark)
The peak and trough would be positioned at the level where the tips of the line were positioned.(1 mark)
(2 marks)
(Total 15 marks)
Question 2
 An alternating current (a.c.) source is connected to a 12 W resistor to form a complete circuit. The trace obtained on an oscilloscope connected across the resistor is shown. An alternating current (a.c.) source is connected to a 12 W resistor to form a complete circuit. The trace obtained on an oscilloscope connected across the resistor is shown.
The oscilloscope settings are:
Y sensitivity 4.0 mV per division and
time base 2.0 s per division.
(a)
(i) Determine the peak to peak voltage of the a.c. source
Peak to peak is 4 divisions (1 mark)
= 4.0 mV x 4 = 16 mV (1 mark for the answer and 1 mark for the unit)
(3 marks)
(ii) Hence determine the peak voltage. (1 mark)
Peak voltage is half of peak to peak - therefore it is 8 mV
(iii) Determine the time period of the a.c. signal.
4 divisions (1 mark) represents 4 x 2.0s = 8.0 s (1 mark for number - 1 for unit)
(3 marks)
(iv) Hence calculate the frequency of the a.c. signal. (3 marks)
f = 1/T ( 1 mark) = 1/8.0 = 0.125 Hz 1 mark for number - 1 for unit)
(3 marks)
(b) Given that:
Peak Voltage (volts) = Peak Current (amps) x resistance (ohms)
calculate the peak current that is flowing through the resistor. (3 marks)
peak current = peak voltage/resistance (1 mark)
= 0.008/14
= 0.57mA (2 marks - 1 for answer - 1 for unit)
(Total 13 marks)
|