    |
||||
 Radioactivity
- stability Radioactivity
- stability |
||||
|
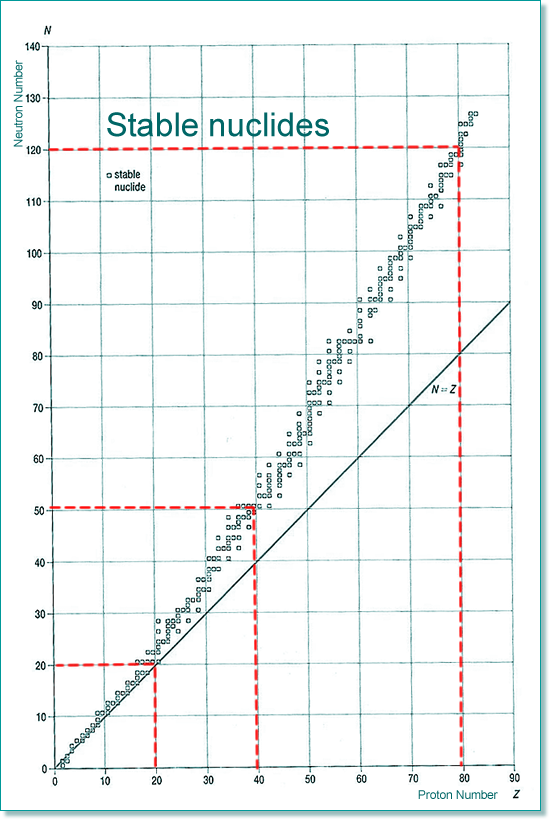
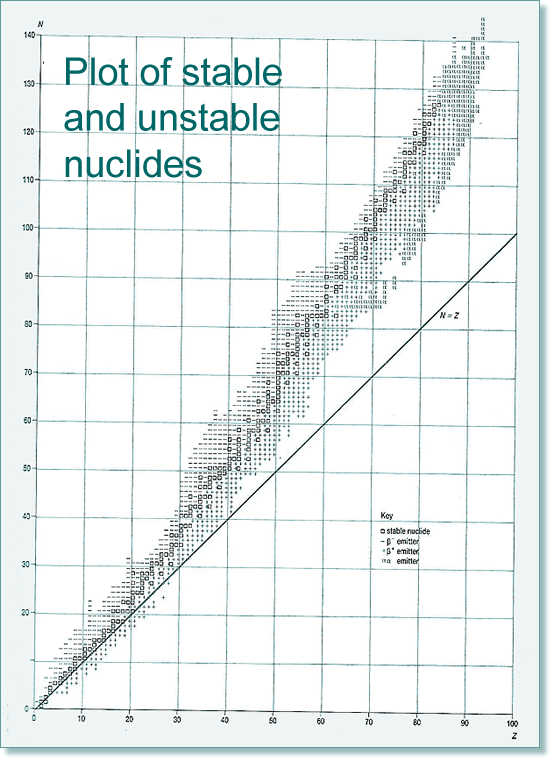
If all of the isotopes are plotted on a chart we find that there is a general trend for those that are stable and those that are unstable lie outside the zone of nuclear stability (rather like a 'line of best fit') The stability zone follows the 1:1 ratio for the first 20 elements, and then an increasing number of neutrons to protons are needed if the nuclide is to be stable. Therefore by element 40 the ratio is 5:4 and by 80 it is 3:2 (easy to remember 5432...). The graph below shows the type of emitters for each unstable nuclide - you can see that there is a pattern of behaviour linked to which side of the stability line they are located. They decay to become more stable - closer to that line!
|
||||
 |
||||


