|
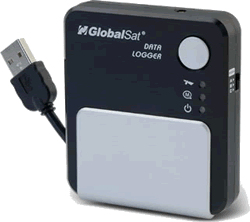
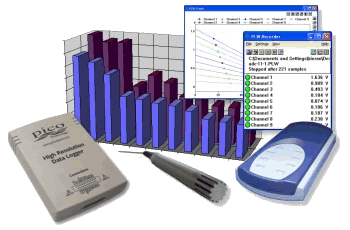
 A data logger (also called datalogger or data recorder) is an electronic device that records data and stores it for you. It can be set to record at regular time intervals or upon the pressing of a key or button. A data logger (also called datalogger or data recorder) is an electronic device that records data and stores it for you. It can be set to record at regular time intervals or upon the pressing of a key or button.
Sensors are usually electrical transducers - things that change a physical quantity such as the loudness of sound into an electrical signal). They detect the physical quantity being monitored (e.g. light level or voltage, current etc) .They are usually designed to feed the information to a digital processor (or computer). They generally are small, battery powered, portable, and equipped with a microprocessor, internal memory for data storage, and sensors.
Some data loggers interface with a personal computer and utilize software to activate the data logger and view and analyze the collected data, while others have a local interface device (keypad, LCD) and can be used as a stand-alone device.
Sample rate is the rate at which measurements are taken e.g. a sample rate of 50 Hz would be a reading taken every 0.02s (50 in a second).

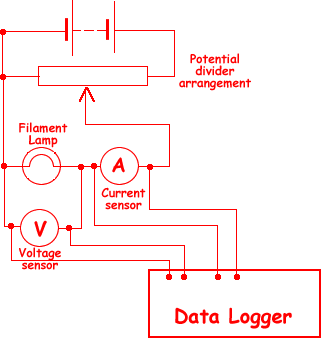
Using a data logger in an electrical circuit.
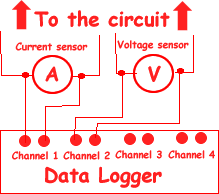
To plot a characteristic curve you would need a current sensor and a voltage sensor. Each of these would have to go to separate 'channels' in the data logger. It is not usual to have the response 'sampled' as you need to physically change the voltage from the supply and then take a reading. It is therefore usually manually sampled by the pressing of a button.
I would not even have this example on here if an exam board did not have this 'experiment' on their syllabus! Data loggers are best for long tedious experiments like light level changes in a room over a week or very rapid sampling like the flicker of an electric light bulb when lit by an a.c. voltage supply. Using them for this seems ludicrous as you do not use the sampling facility and might as well just take readings!.
You could I suppose set it up and then steadily increase the voltage supply, allowing sampling to occur. To do this you would have to select the same sampling speed for each sensor and the same starting time for each and then select a voltage/current display for the same time intervals after the sampling was complete..
 To draw this on a circuit diagram you would simply draw a box with the words 'data logger' in it and connect that to the sensors. The sensors would have to be placed into a circuit appropriately. For example a current sensor is effectively an ammeter so it would be put in series with the component you wished to measure the current through. Similarly a voltage sensor would have to be put in parallel with the component you were monitoring with the data logger. To draw this on a circuit diagram you would simply draw a box with the words 'data logger' in it and connect that to the sensors. The sensors would have to be placed into a circuit appropriately. For example a current sensor is effectively an ammeter so it would be put in series with the component you wished to measure the current through. Similarly a voltage sensor would have to be put in parallel with the component you were monitoring with the data logger.
I suggest that you use the symbols for ammeter and voltmeter in your diagram but label them as sensors. Make sure you put them correctly into your circuit diagram - current sensor in series and voltage sensor in parallel.

Remember
- Dataloggers are no more or less accurate than regular meters
- Sometimes the software give an impressive number of significant figures in the data list - but this may not be representative of the accuracy - just the whim of the programmer!
- Datalogger probes and sensors can have faults that lead to false data being colllected.
- For a simple experiment they do not save time as they can take a lot of time to set up - but for vast numbers of readings over a long time they are a very valuable tool!
|