
 |
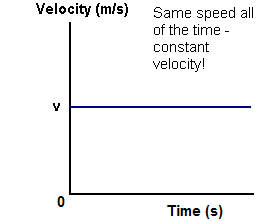
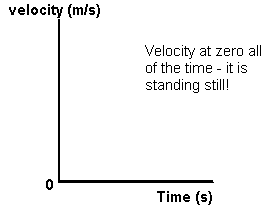
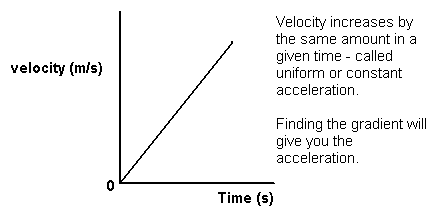
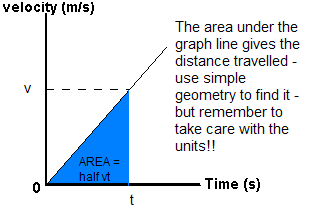
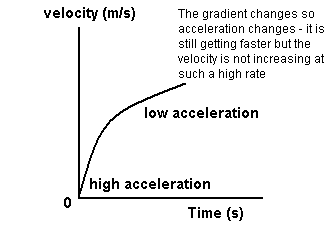
Velocity - Time Graphs Velocily - time graphs represent how the velocity of an object changes as time progresses. Time (as always!) is on the x-axis and displacement on the y-axis. You may be given data and asked to plot a graph or you may be asked to interpret of sketch one. You should be able to do all of these things. Rather than 'learn' these graphs you should aim to understand them. Talk yourself through what the line represents in terms of 'the object starts off travelling at 'so many metres per second' at t=0 seconds and then is at 'such and such velocity' by the next second....' etc. You can then tell whether it is speeding up of slowing down. The gradient of the line represents the acceleration. You need to know how to work out a gradient and show how you have done it. Do NOT just write down an answer. The area under the graph represents the distance travelled. Break this up into stages if necessary to give yourself a series of triangles and rectangles to find the area of. Always mark out what you are doing clearly for the examiner, so that s/he can follow what you are doing!
LOJ March 2003 |
Follow me...
|


Cyberphysics - a web-based teaching aid - for students of physics, their teachers and parents....
