Characteristic Curves
Current-voltage graphs are used to show how the current through a component varies with the voltage you put across it.
It is a physicist's way to see at a glance how a component behaves when a particular range of potential differences are applied across it.
These graphs are called Characteristic Curves.
To find the characteristic for a component you vary the potential difference across it (so p.d. or voltage is the independent variable and it plotted on the x-axis) and note down the current that flows for each voltage (the dependent variable - plotted on the y axis).
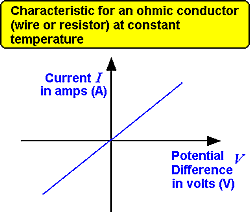
The current through an ohmic conductor (e.g. a wire) (at constant temperature) is proportional to the voltage across the resistor resulting n a straight line through the origin.
This characteristic is described by Ohm's Law :
The ratio of the potential difference across the ends of a current carrying conductor to the current flowing though it is constant (providing the temperature is constant).
 Click here for an interactive experiment. Click here for an interactive experiment.
|
 |
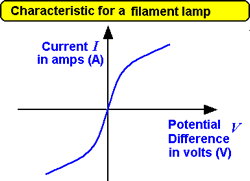
The resistance of a filament lamp increases as the temperature of the filament increases.
When the p.d. across it is small the current is small and the wire does not get very hot - the temperature is almost constant and the line is stright (near to the origin point).
It is while the wire of the filament has current going through it that causes it to change temperature a lot that we see the most curvature in the graph line.
When it gets to maximum temperature we see a steady straight line again.... but at a higher resistance than when cool.
For details on an experiment to determine the characteristic curve for a filament lamp: click here |
 |
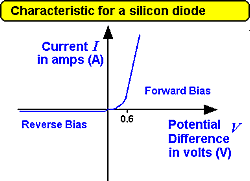
The current through a silicon diode effectively only flows in one direction only.
It's resistance is very low when connected in 'forward bias' as long as it has a potential difference of more than 0.6 volts across it.
The diode has a very high resistance in the reverse direction therefore only a tiny current flows.
Click here for more detail. |
 |
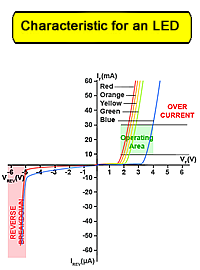
Notice the considerable difference between the forward voltage (VF) for blue types and red to green types.
Blue LEDs also typically have a greater reverse leakage current (IREV) than other LEDs but the safe limit for most LEDs is considered to be around -5V, a VERY LOW value compared with silicon diodes, which may have reverse breakdown voltages measured in tens or hundreds of volts.
Therefore LEDs are more easily damaged by relatively small values of either excess forward current, or reverse voltage compared to ordinary silicon diodes, so to take advantage of the LED´s excellent reliability, care must be taken to ensure that any LED operates within its safe operating area.
Click here for more detail. |
|
 You should know how to sketch these curves - and be able to interpret them at GCSE level and above.
You may also be given graphical information for the LDR and thermistor. These will be shown as a curve relating how a physical condition (light intensity or temperature) affects the resistance of the sensor.
 The resistance of a light dependent resistor decreases as the light intensity increases.
The resistance of a thermistor decreases as the temperature increases. (There are some thermistors which behave in the opposite way to this but all of your questions will be set on this version).
 |
Ready for some questions?
Click on the icon - questions and answers at A level standard await you!
For more topics that have practice questions associated with them see the upper left menu bar
|