
 |
A Practical Experiment - To determine that the Inverse Square Law applies to Gamma Rays IntroductionGamma radiation from a point source spreads out radialy as it travels away from the source. Within the lab you can ignore absorption by the air in the room. Gamma radiation is very penetrating. Absorption of gamma rays depends upon the density of the material that the gamma rays are travelling though. The density of air is not great, therefore it does not absorb gamma rays very well. A parallel beam of gamma rays would need to travel a long distance through air before much of a difference in intensity of radiation could be determined. When travelling from the Sun through the Earth's atmosphere to sea level, gamma rays travel through a great enough distance in air to be absorbed completely. However the distance travelled within a laboratory setting is so small that we can regard gamma rays as not being absorbed by air. In this investigation, your task is to verify that the inverse square law applies to gamma radiation.
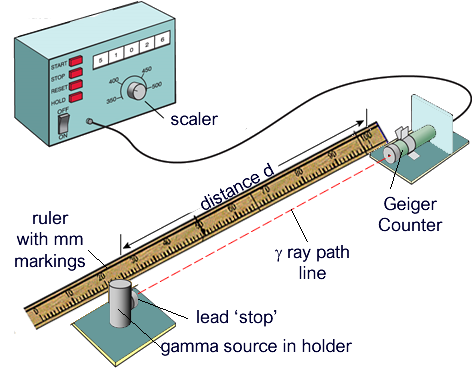
SafetyAdhere to your school's rules for the use of radioactive materials (eg. signing in and out, not leaving them unattended, warning notice on the door... etc.) Long-handled tongs should be used to transfer the source. be careful not to drop it. Situate the source as far away as possible from where you (or your classmates) are working. Point the source away from your body. Return the source to its storage box as soon as you have completed your measurements. Apparatus
ProcedureTake a background reading Without the source of γ radiation present, connect the Geiger tube to the scaler counter. Remove the tube's protective end cap and measure the background count rate, C0. It is best to do this over as long a time as you can. While the background is being counted you can set up the rest of the equipment and make yourself a blank table so you are ready to enter your results. You then need to work out how much of a background reading there would be on average in 100s. This will be deducted from the cound made in your experiment to give you a count that eminates just from the source. Decide on the range of readings you will take In order to get a set of results that will allow you to plot a good graph, you need to have a minimum of eight readings. I suggest ten! Fix the ruler to the bench (blu tac can be useful for this) and put the Geiger tube in place at one end of the rule - it is useful to fix that in place too. Take readings Place the gamma source at a chosen distance from the geiger counter. Remove the lead stop. Start the timer and counter. Measure and record the number of counts in 100 seconds. Repeat this procedure for each of your chosen distances. Repeat the whole experiment twice, giving you three sets of readings for each distance. Analysing your results According to the inverse square law, the intensity, I, of the γ radiation from a point source depends on the distance, r, from the source ∴I is proportional to so C − C0= Let us take the square root of both sides of this equation and replace constant k with constant m where m = Rearranging this revised equation gives us d = This is in the form of a straight line graph Y = mx + c ConclusionThe experiment will show the inverse square relationship for gamma rays if you have obtained a straight line. The closer your points are to that line the better your experiment will have demonstrated the relationship. Additional InformationYour graph can also be used to find the correction distance d0. |
Follow me...
|

 − d0
− d0 should give us a straight line with an intercept on the y-axis equal to −d0.


Cyberphysics - a web-based teaching aid - for students of physics, their teachers and parents....
